Forecasts
IN THIS ARTICLE
Forecasts is where you pressure-test capacity, revenue, and delivery dates across deals.
Overview
Forecasts brings capacity, revenue timing, and schedules into one place so you can make trade-offs across deals, and apply changes safely.
- Get a snapshot of your current pipeline
- Confirm capacity before committing a deal
- Understand how revenue shifts if timelines change
- See which deals are driving demand peaks or gaps
- Test schedule changes before applying them
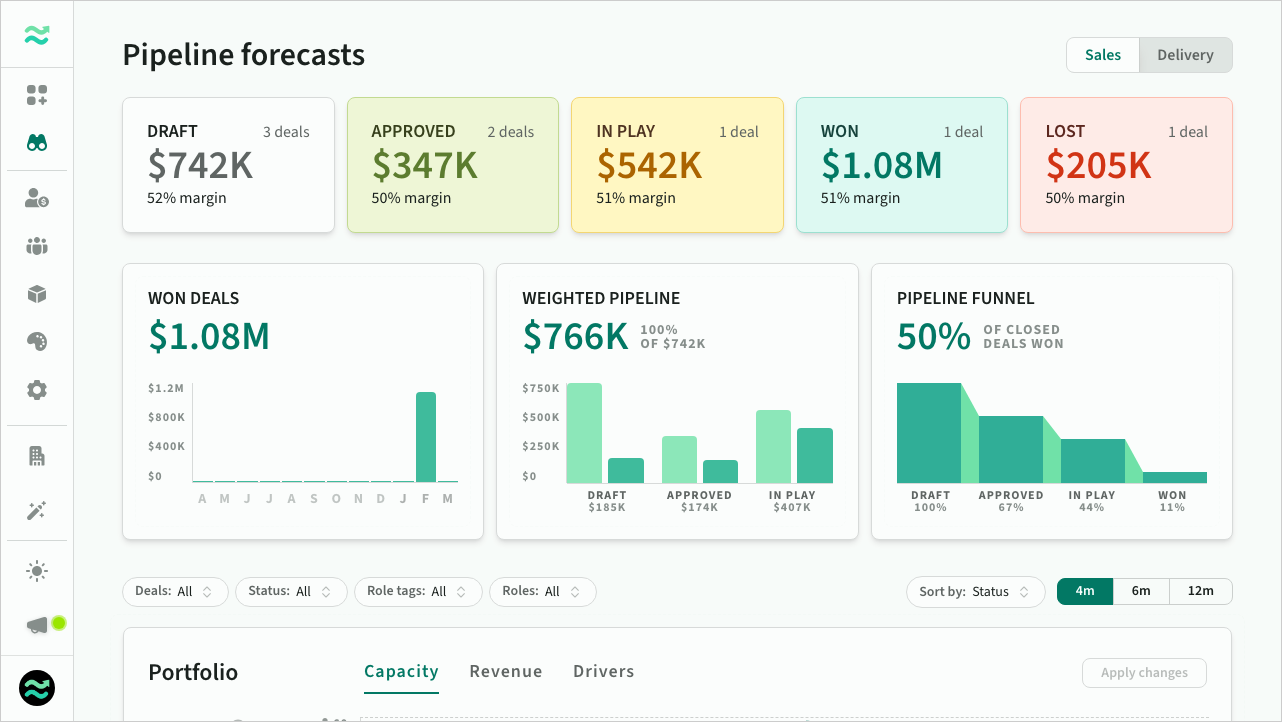
Pipeline metrics
At the top of Forecasts, use Stats and Metrics to get a quick snapshot of your pipeline for the selected filters and time period.
- Stats: Deal count, value, and margin by status (Draft, Approved, In play, Won, Lost).
- Metrics: Pipeline health at a glance, including Won deals, Weighted pipeline, and the Pipeline funnel win rate.
Right click on a chart/graph to copy as an image
 Forecast planning workspace
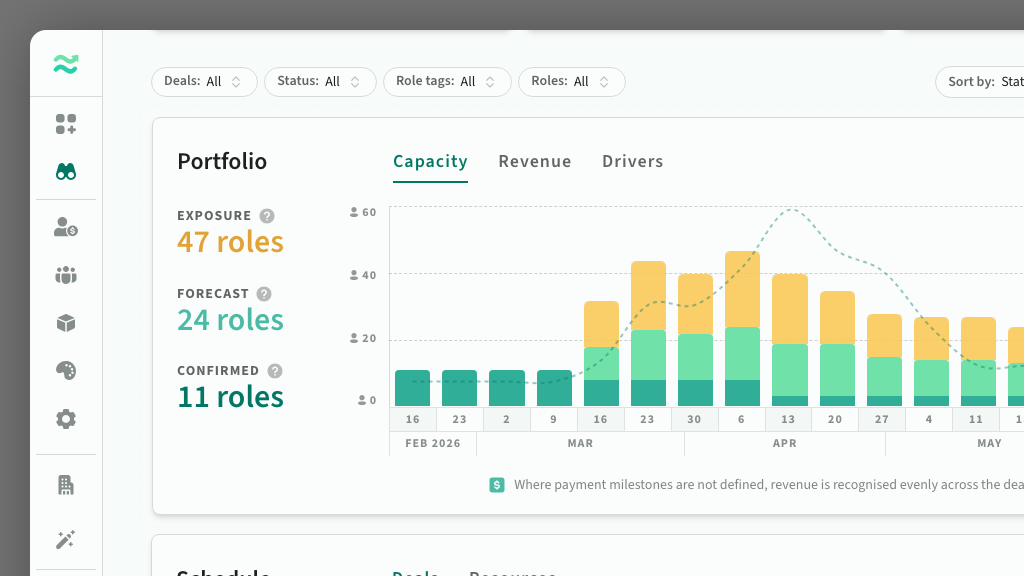
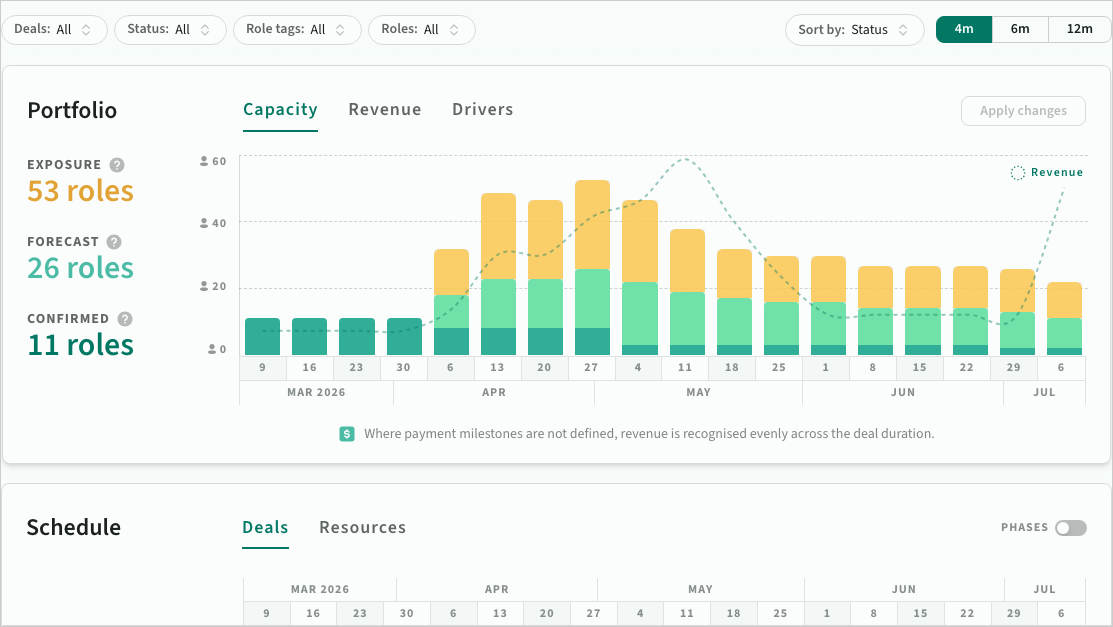
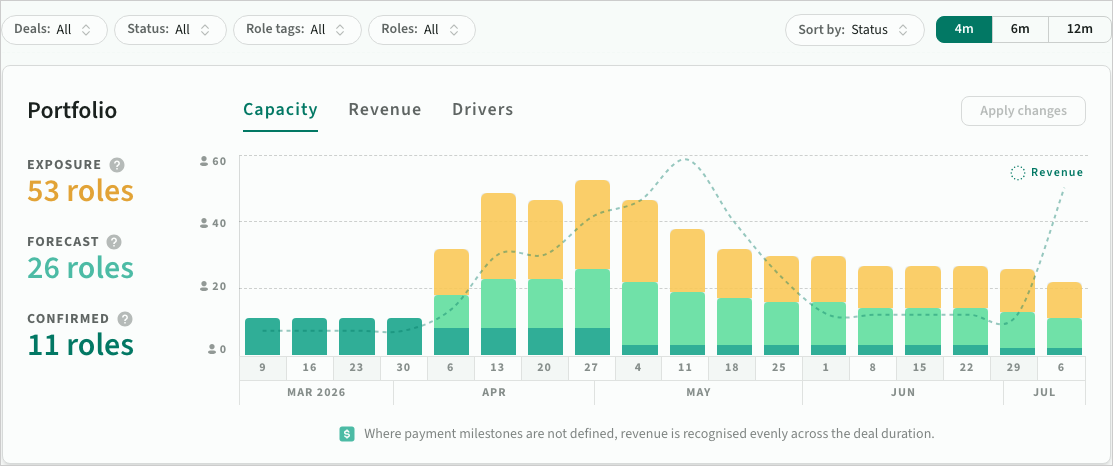
Capacity levels
The forecast portfolio shows capacity over time at three levels:
- Confirmed: Capacity from confirmed deals only
- Forecast: Expected capacity based on current deal probabilities
- Exposure: Total capacity if all open deals close.
 Forecast planning workspace
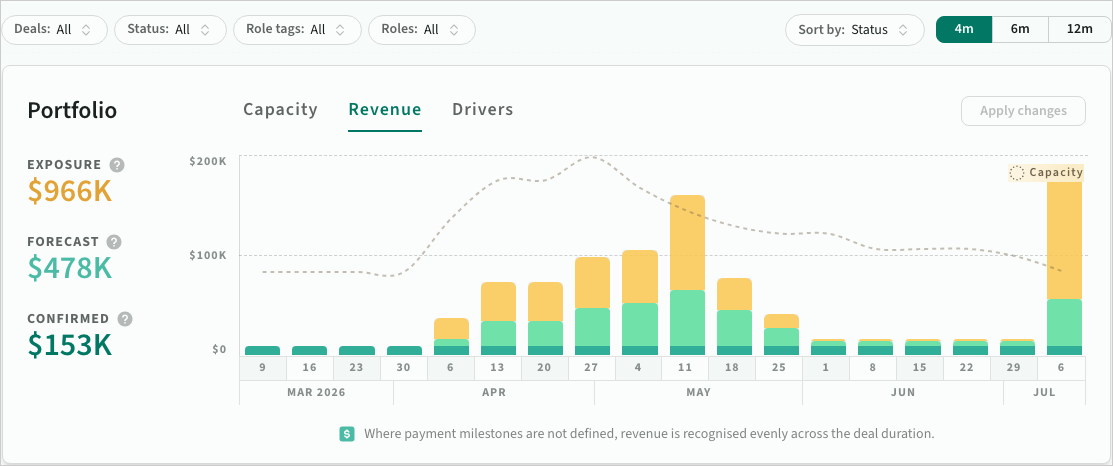
Revenue recognition
See how revenue is recognised across time, based on real payment milestones where they are defined. When milestone data is missing, Forecasts applies sensible recognition automatically.
This helps you spot cashflow gaps or delivery mismatches earlier, even while deal details are still evolving.
 Revenue over time in forecasts
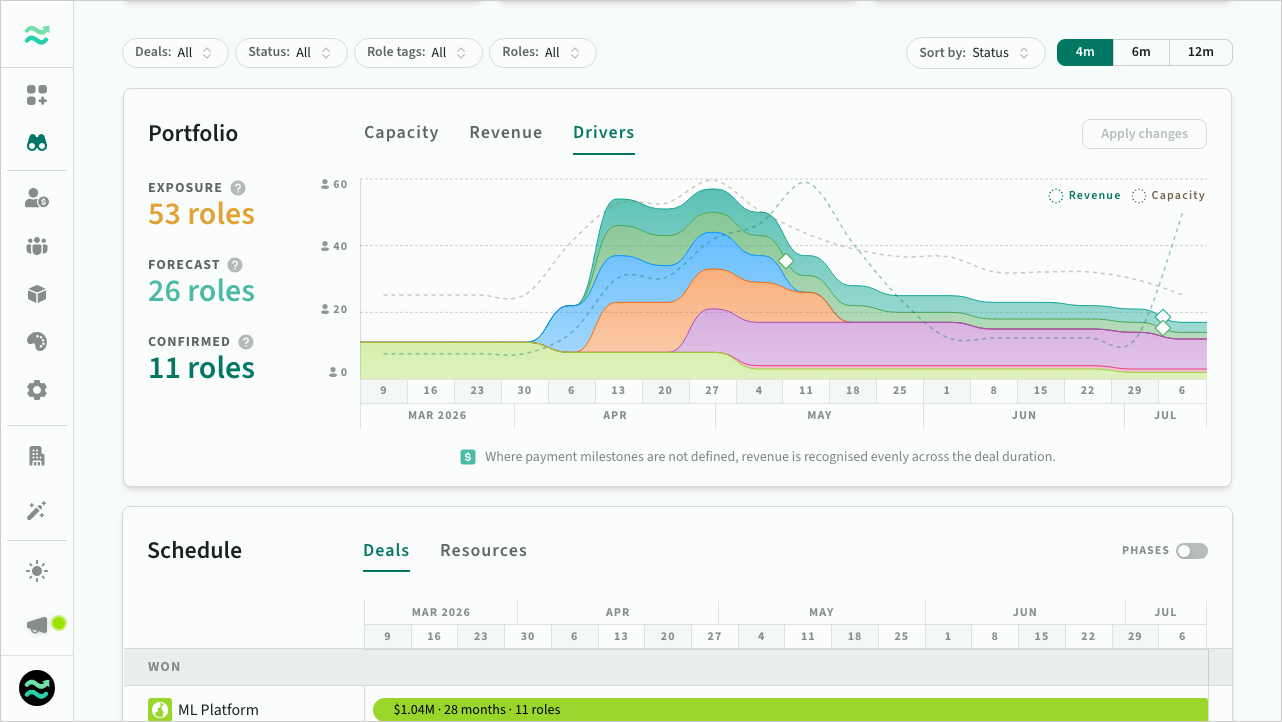
Deal drivers
The Drivers view highlights which specific deals are creating peaks or gaps in capacity.
Hover over a deal to highlight related schedule rows and resources automatically across connected views. This makes it easier to understand impact instantly.
 Deal drivers in forecasts
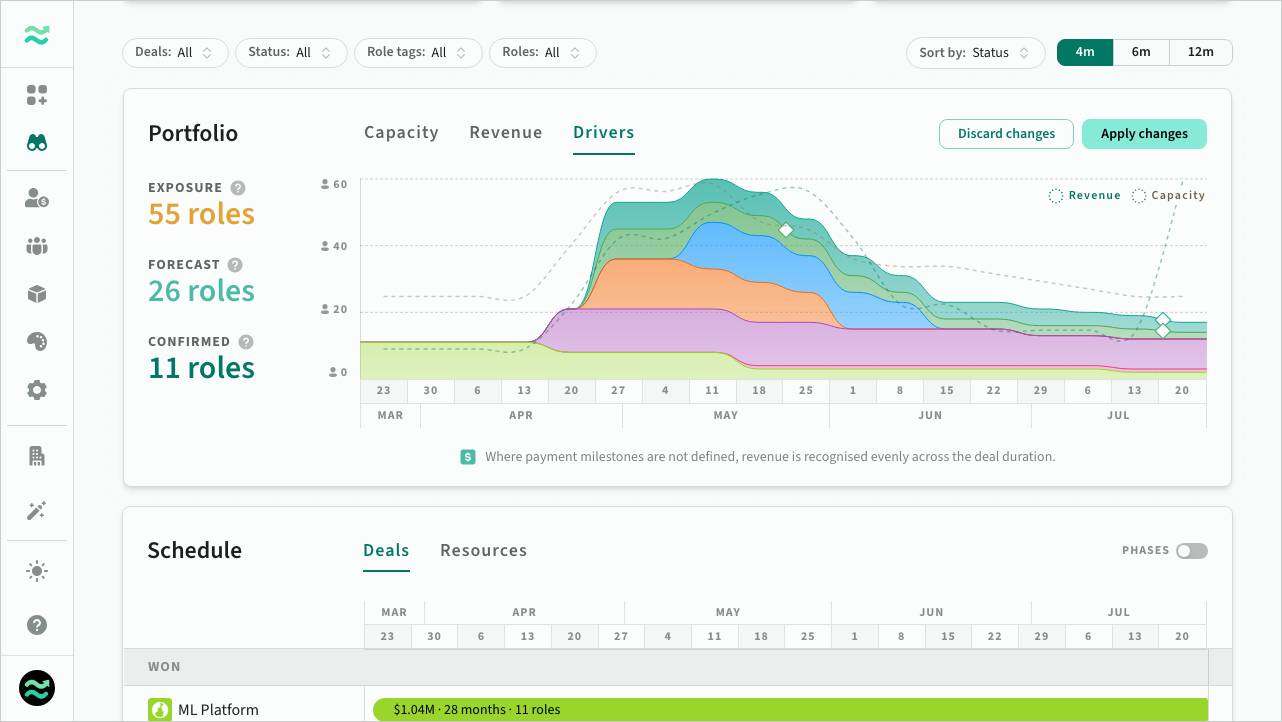
Rescheduling
Use the rescheduling workflow to try date shifts before committing. Drag deals along the timeline, review the proposed updates, then apply them in one step.
Revenue and capacity update automatically as you adjust dates.
 Reschedule deals by dragging deals in Drivers or Deal Schedule views
When you apply schedule changes:
- Locked deals create a snapshot for traceability
- Draft deals update immediately
- Stale edits are flagged so you can refresh before applying
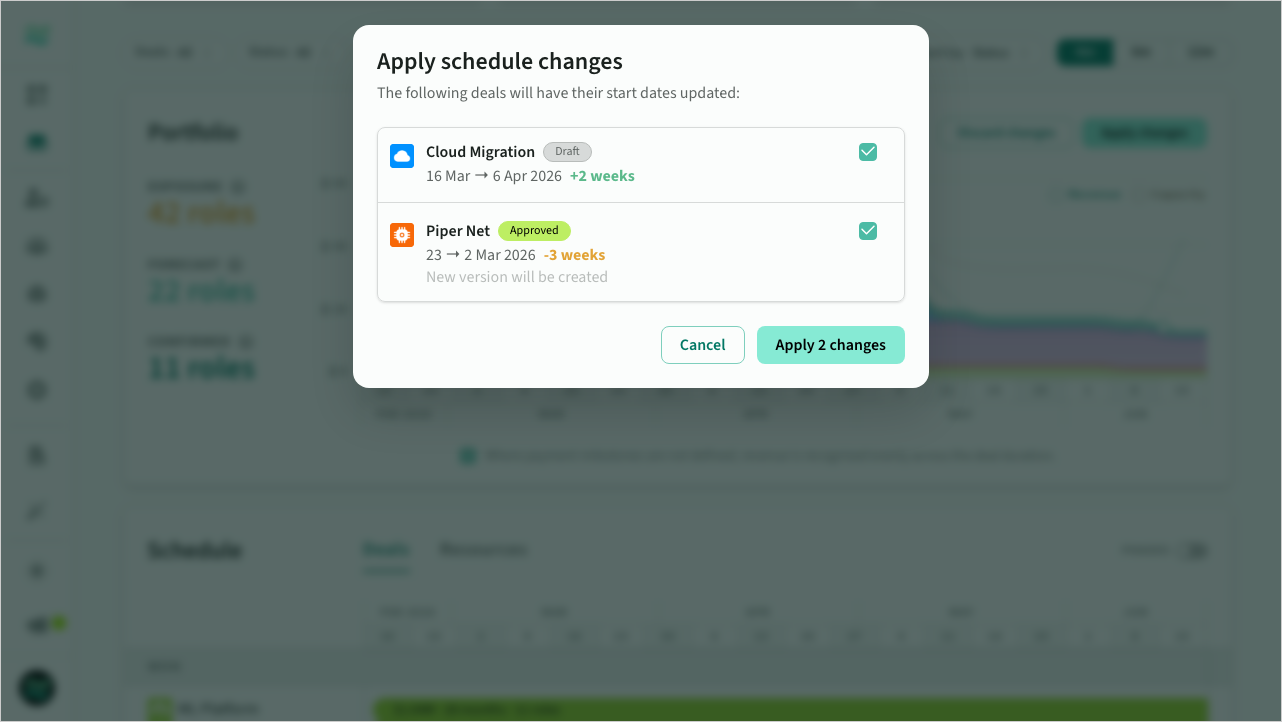 Apply changes dialog
Scheduled deals
Use the deal schedule to drill into deal milestones and phases.
You can also reschedule deals directly from the deal schedule view.
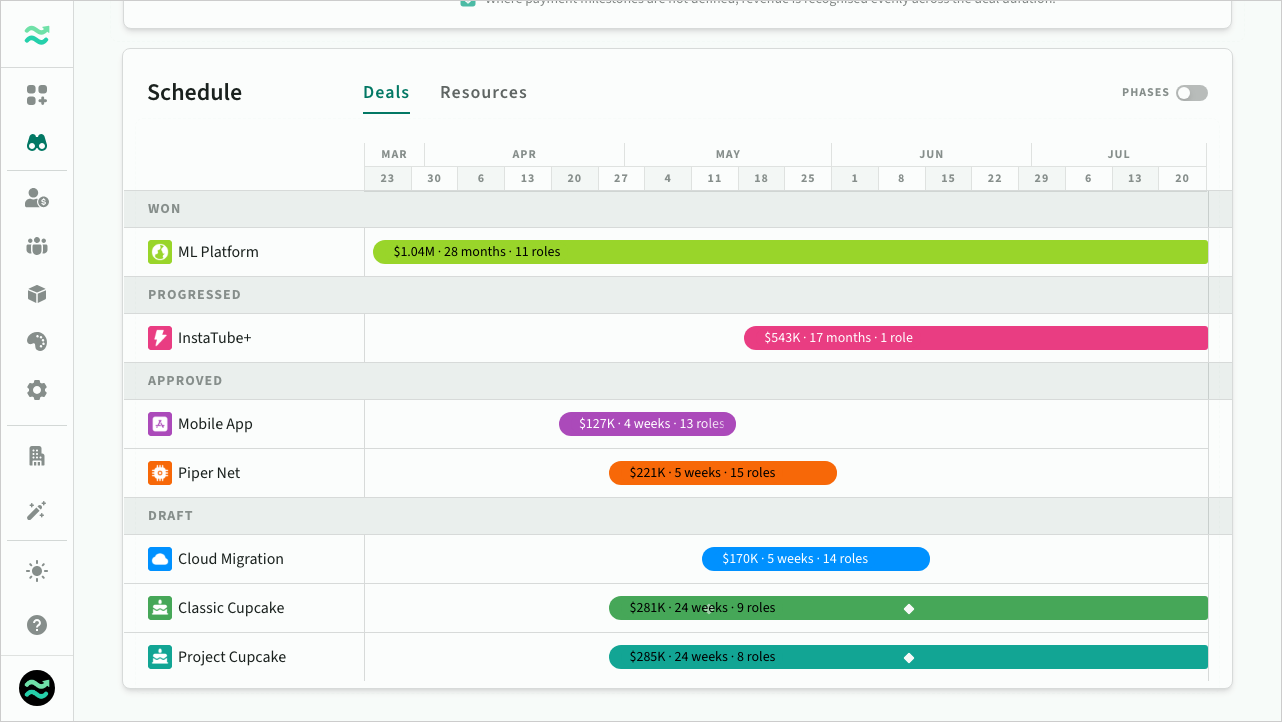 Deal schedule with milestones
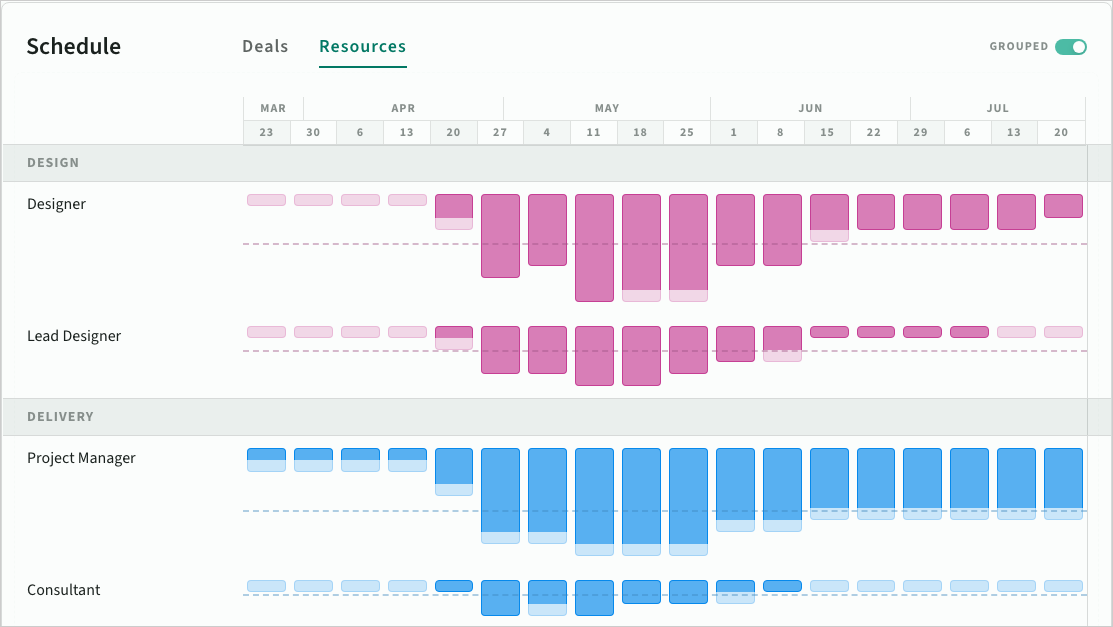
Scheduled resources
Use the resource schedule view to drill into capacity demand without losing the portfolio context.
Hover over a deal in the Drivers view to highlight related resources automatically.
 Resource schedule
Forecast filters
Use the bar above the Portfolio charts to control what you see across both Portfolio and Schedule.
- Deals: Show a subset of deals (or exclude a small set).
- Status: Filter by deal status.
- Role tags: Filter roles by tag (shown when your space uses role tags).
- Roles: Filter by role.
- Sort by: Change the deal ordering (Status, Start date, End date, Capacity, Name).
- Time period: Choose 4m, 6m, or 12m (the next 4/6/12 months).
- Reset all: Clear the current filters.
Your workspace state is remembered, including active filters and selected tabs after refresh.
 Forecasts filters