


Introduction
Run a post-mortem on an unprofitable services project and scope creep gets named inside ten minutes. It's the natural suspect. Visible, negotiable, and usually someone else's fault. But pull the cost apart line by line and the story is often different. The scope barely moved. The project just took longer.
Every services deal carries two kinds of cost, and most estimation processes only price one of them carefully.
If your deals already live in Estii, the prompt below will generate the report from your deal data. If not, the same arithmetic works in a spreadsheet. The rest of the article explains the maths behind it: week-rate, break-even point, and how much runway a slipped schedule burns.
For Estii users: point any AI connected to the Estii MCP server at a live deal and it returns the week-rate, margin erosion per week, runway against your margin floor, and the break-even chart.
Part I: The hidden cost of calendar slip
Every deal has effort cost and calendar cost
Effort cost is the scoped work. 100 days of consulting, engineering, or design is 100 days whether it ships in 12 weeks or 20. It gets estimated bottom-up, reviewed, challenged, and buffered with contingency.
Duration cost is calendar cost: everything that accrues regardless of scope. Project management, delivery leadership, quality oversight, reporting, the standing meetings. It's usually added as a percentage uplift or a lump sum, then never examined again.
Then the schedule moves, and the afterthought becomes the biggest variable cost in the deal.
AI is turning this imbalance from an annoyance into a central commercial problem. It compresses the effort side of projects, the side that gets priced carefully, and barely touches the per-week side. Effort was the bulk of every deal, which meant it was also the buffer. As it shrinks, every number in this article gets worse.
The number to find is your calendar cost per week
Almost nobody can say what one week of their project costs before anyone touches scoped work. It takes two minutes to find out: add up the weekly cost of every overhead role, plus anything else that bills by the period rather than the deliverable.
Project manager     2.5 d/wk x $800/d    = $2,000
Delivery lead       1.0 d/wk x $1,000/d  = $1,000
Quality oversight   1.0 d/wk x $700/d    = $700
Week-rate                                = $3,700
That's the cost of the project existing for a week. No deliverables. Just the clock running.
The break-even point is closer than profit suggests
Gross margin has a job. It pays for everything that isn't inside the deal: sales, marketing, operations, the bench, growth. For a services business the survival line sits around 50% gross margin across the portfolio, and healthy is closer to 60%. Managed services typically run 45-60%. Professional services and consulting, 55-70%.
Build phases often sit near the low end of services-margin targets: roughly 40-55% for implementation work.
Now the arithmetic. A 12-week build with $70K of scoped effort and a $3.7K week-rate costs around $114K to deliver. Price it at 55%, the disciplined end of the range, and it sells for $254K carrying $140K of gross profit. Against a 50% floor, the true slack is $13K. Divide by the week-rate and the runway is three and a half weeks. Each week of slip costs about a point and a half of margin, so a month late puts even this well-priced build under the survival line.
And that was the good case. A build signed at 45%, with the run phase expected to blend the portfolio back up, is below the floor before the kickoff meeting. Its break-even week has already passed. There's no runway to burn; every slipped week converts straight to loss.
Every committed-price project has a break-even point in the schedule, and it's far closer than the profit line suggests. Chart it once, scoped cost flat, duration cost climbing, margin starting near the floor and sliding through it, and it's hard to unsee.
The prompt on this page is the one we use in Estii to generate these reports from deal data. Here's an example of the output: a 12-week portal build, priced at a healthy-looking 53.5% against a 50% floor. Week-rate $2.5K, eroding 1.4 points of margin per week. Runway: 2.5 weeks. A month late and it's well under the floor.
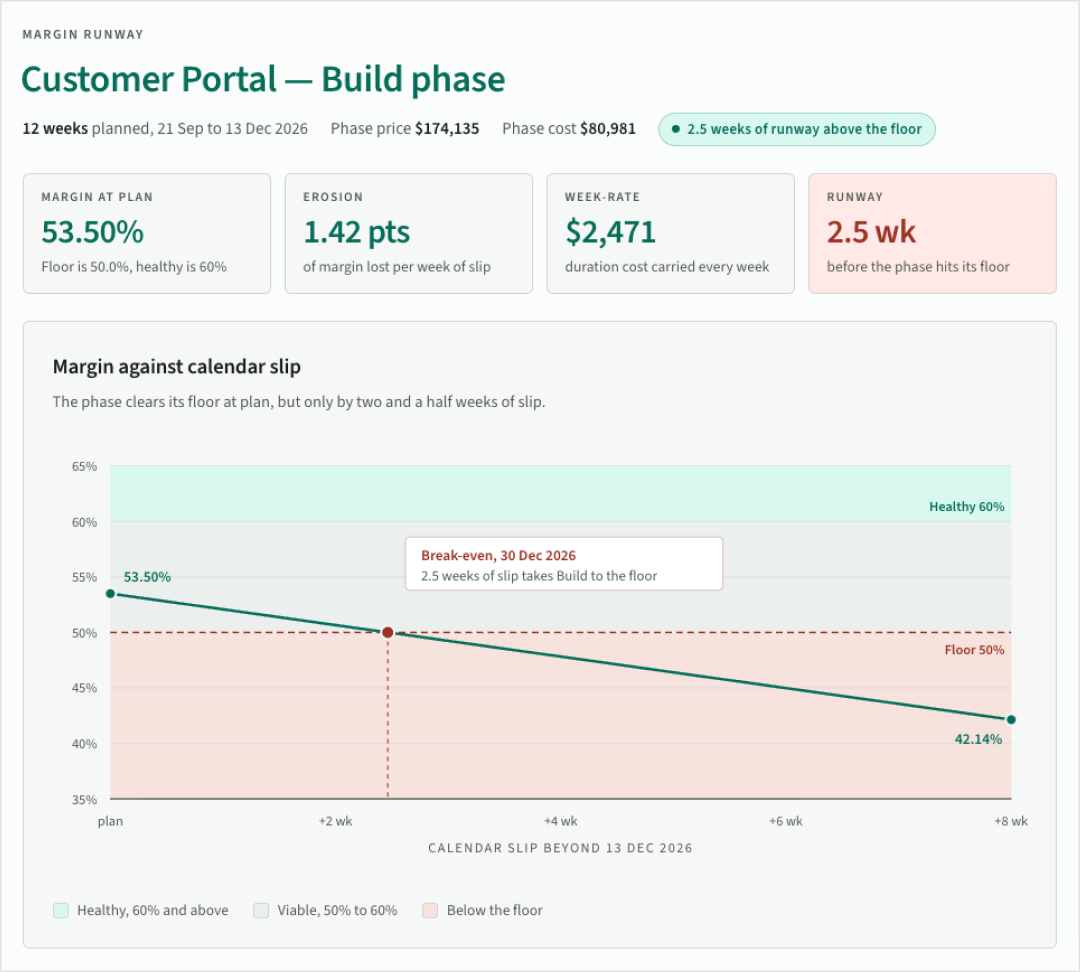 Margin-runway report for a 12-week portal build: 53.5% margin at plan against a 50% floor, a $2,471 week-rate, and a break-even week 2.5 weeks past the planned finish
Part II: Why build phases carry the schedule risk
Why the calendar slips when the scope doesn't
Client approvals. Environment access. Feedback rounds that take three weeks instead of three days. Decision latency, dependency waits, holidays. None of these change scope. All of them extend the calendar.
The asymmetry is what keeps this invisible. Scope creep needs the client to ask for something, so it's seen and negotiated. Duration creep needs nobody to do anything. Scope creep has a villain. Duration creep doesn't.
Build phases carry the schedule risk
Anyone running a services P&L has seen the pattern: build phases post worse margins than run phases, project after project. The two kinds of cost explain why.
In a run contract, duration is the unit of sale. A one-year managed service is priced per period, and the work is mostly the recurring kind: steady allocations, predictable oversight. The calendar can't slip because the calendar is what's being sold.
A build phase is the opposite. It concentrates the scoped effort, and its duration is an assumption, not a unit of sale. Every risk in this article, slip, ramp, client latency, lands on the build.
That's also why a portfolio can look fine while every build bleeds: the runs are subsidising the calendar. Run contracts price the week. Build contracts bet on it.
Effort contingency does not protect calendar slip
Contingency is usually applied to effort. Rate the risk, multiply the estimate, done. Sometimes it stacks without anyone naming it: the SME adds buffer, the solution lead adds contingency, then sales adds another deal-level margin.
That may protect against underestimating the work, but it still does not answer the calendar question: how many weeks of delay can this deal absorb?
Duration risk extends the calendar with zero scope change, and effort contingency never touches it.
So a services business will carry a 15% buffer against the risk that rarely kills a deal, and no buffer at all against the one that does.
Part III: Why the buffer is shrinking
AI compresses effort faster than calendar cost
The last structural shift in services, the offshore wave, changed what an hour costs. AI changes how many hours there are. Build work that took 100 delivery days is heading toward 60, and clients know it.
The per-week side doesn't compress with it. A project still needs a project manager in front of the client; plenty of what sits behind that role can be automated, but the role can't. And the client's clock doesn't change at all. Sign-off cadence, feedback rounds, and approval chains run at the pace the client's organisation sets, not the pace your delivery method allows.
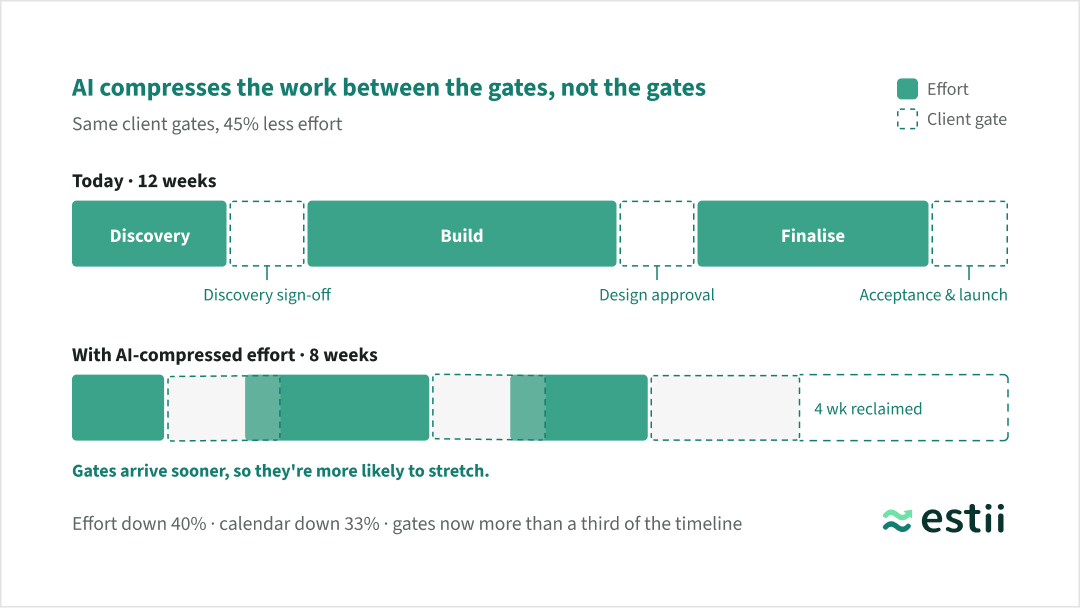 Two project timelines compared: effort blocks compressed 45% by AI while client approval gates stay the same width, so the calendar shortens only 35% and gates grow to more than a third of the timeline
And holding the gates at their current width is the optimistic case. Most clients need real lead time to turn a decision around: reviewers to book, stakeholders to align, feedback to gather. Compress the delivery between the gates and each sign-off arrives before the client is ready for it. A decision they used to see coming for six weeks now lands in three. So as the effort shrinks, the buffer around each client milestone needs to grow, and almost nobody is pricing it that way.
Run the earlier example with effort compressed 40%. Price follows effort down, profit shrinks with it, and the week-rate barely moves. Three and a half weeks of slack become about two, against the same client, the same approval chains, the same duration risk. The deal got smaller. The risk didn't.
And the compression lands hardest exactly where the risk already lives: the build. None of this argues against AI in delivery. The compression is happening whether or not you lead it, and clients will price it in either way. It does mean the commercial model has to move with the delivery model. In most services businesses it isn't moving.
If the supplier is committing to a fixed price, the client needs to commit to a fixed decision cadence.
Ramp-up turns unused effort into schedule delay
Plans assume a full team from day one. Reality is a ramp. People are finishing previous engagements, hires haven't started, subcontractors have lead times, client-side onboarding drags. So projects kick off with a skeleton crew.
One role is always there from the start though: the one the project can't start without. The overhead clock begins at kickoff, at full week-rate, while the team that consumes the scoped effort arrives in pieces.
The scoped work doesn't shrink to match. 100 days is still 100 days, so every under-staffed week pushes the end date out, and every pushed week costs the week-rate. The skeleton crew doesn't save money. It converts effort cost, which was priced, into calendar cost, which wasn't.
The cruel part is the reporting. Early burn looks great, because half the team hasn't landed. "Tracking under budget" in month one is often the first symptom of a project that will finish over cost.
More governance can raise the cost of delay
What happens after a margin miss makes all of this worse. I watched it from the inside for years: every time we underquoted a project, the instinct was to strengthen governance on the next one, through overheads.
The post-mortem blames control, so the fix is oversight: another management layer, a steering cadence, more approval gates. Every one of those raises the week-rate on every future project. And approval gates add latency, which adds weeks.
That's the loop. A fix that raises the price of a week and increases the number of weeks at the same time. Add a governance layer that lifts the week-rate 50% and three and a half weeks of slack drop to barely two before anything has slipped.
Larger organisations loop harder, because adding process is the safe response. Oversight looks prudent, blame diffuses, and nobody's P&L owns the week-rate, so it ratchets up and never down.
The way out is a better post-mortem question: which axis failed? Was the effort estimated wrong, or did the calendar slip? Governance fixes control problems, not pricing problems, and most margin misses are pricing problems. You can't inspect margin into a deal.
Conclusion: price the calendar before signing
Services businesses already run a review discipline built around the cost of an hour: utilisation, blended rates, estimate versus actual effort. Calendar exposure needs the same discipline.
| Managing the hour | Managing calendar exposure |
|---|---|
| What an hour costs | What each period of delay costs |
| Estimate vs actual effort | Planned vs actual duration |
| Utilisation and blended rate | Week-rate and slip runway |
| Contingency on effort | Contingency on effort and calendar |
| Scope assumptions in the SOW | Calendar assumptions and an extension rate |
Three numbers before signing:
- Your week-rate. Two minutes on a live deal.
- Your runway. Gross profit above your margin floor, divided by week-rate. On a well-priced build it's about three weeks. On many builds it's negative at signature. Compare it honestly with how late your last three projects actually ran.
- The price of client delay. Put calendar assumptions in the SOW next to the scope assumptions: approval turnaround, access, feedback windows, and an extension rate so client-side delay has a price.
None of this needs new software. A spreadsheet and one honest hour will get you the first two numbers.
Services businesses learned to manage the cost of an hour because labour was the main constraint. As effort compresses, the same discipline has to move to calendar exposure.
Before the deal is signed, know what a schedule slip will do to the margin.
If your deals already live in Estii, connect your AI to the Estii MCP server and paste the prompt below against a live deal. It splits the build phase's cost into effort and duration buckets, lets you correct the classification, then builds the same week-rate, runway, erosion, and break-even report shown above.
For Estii users: copy this into any AI connected to the Estii MCP server, or download it to keep alongside your own deal review notes.
Useful sources
- ConnectWise / Service Leadership, Q2 2024 Service Leadership Index data
- PMI fixed-price contract paper, The special challenges of project management under fixed-price contracts
- SPI Research, 2025 Professional Services Maturity Benchmark release