


A CEO I spoke to last year put the problem plainly. "Sales is having its best quarter ever. Delivery is melting. Finance can't recognise the revenue yet. I don't know if we're growing or just pretending to."
That is the honest version of the growth-stage technology solution provider dilemma. The bookings line is up. The delivered-margin line is flat or down. The people on the ground are working harder than they were a year ago. And the gap between the three is widening instead of closing.
Revenue velocity is the rate at which closed pipeline becomes recognised revenue, without destroying the delivery team that earns it. It is not a bookings metric. It is not a delivery metric. It is the full cycle from quote to cash, measured as one thing, because the thing that is broken in most services firms is the handoff between the parts, not the parts.
This guide is a CEO-level walk through that cycle, the points where it breaks, and the metrics that tell you whether your firm is running well or just busy.
Growth that costs margin isn't growth
There are four common moves a CEO reaches for when the firm is selling faster than it can deliver. Each one costs something, and most firms end up doing all four at once without naming the cost.
Hire into the gap. The intuitive answer. The trouble is the gap is almost always role-specific, and hiring senior practitioners takes three to six months. The deals that sold last quarter need to be staffed this quarter. Hiring is the right answer on a horizon longer than the horizon of the problem.
Slow sales down. Rare, because nobody in a growth-stage firm wants to be the executive who said "sell less". Sometimes the right answer, almost never the popular one. Usually arrives as a quiet message from delivery leads that becomes a loud message in a board meeting.
Work people harder. The default. Rarely decided, usually just happens. Costs show up as attrition, quality issues, and delivered-margin erosion over six to twelve months. The cost is real. It is just deferred.
Subcontract the pressure. Bring in contractors or partner firms to hold the line. Works for a quarter. Dilutes margin. Creates a delivery quality risk that is hard to see until it lands in a customer escalation.
All four moves have a place. None of them works as a primary strategy, and the firms that rely on one start to look, from the CEO seat, like they are running in place despite growing. The reframe is to stop asking "how do we keep up?" and start asking "where in the cycle is the firm losing the most time and margin?" The answer is almost never "everywhere equally."
The five-stage cycle from quote to cash
Split the cycle into five stages. Every one has a different owner, a different bottleneck pattern, and a different intervention. The CEO's job is to know which stage is costing the firm the most right now, because the answer shifts as the firm grows.
- Quote shape. From first qualified conversation to proposal out the door.
- Close. From proposal out to contract signed.
- Signed-to-started. From contract signed to real delivery kickoff.
- Delivery. From kickoff to final acceptance.
- Invoice and recognition. From acceptance to cash in the bank and revenue on the P&L.
Sales optimises stages one and two. Delivery optimises stage four. Finance lives in stage five. Stage three is the gap nobody owns. The CEO is the only person in the firm whose horizon covers all five, which is why cycle-time problems show up as CEO problems even when each individual stage looks fine.
Stage one, the shape of the quote
A quote is a commitment to a shape of work: scope, role mix, schedule, price. The quality of that shape determines what happens in the other four stages. A deal quoted at a shape that is not deliverable at the firm's current capacity will consume time in every subsequent stage to renegotiate back to something that is.
The move at this stage is capacity-aware selling. The seller can see role-level delivery headroom and weighted pipeline pressure at the moment they are pricing the deal, not in a Monday resourcing meeting two weeks after the buyer has been given a start date. Three levers, ranked by commercial cost: shift the start date, trim or rephase scope, change the role mix. In that order, always.
For the full treatment of this stage, including the weekly ritual that keeps sales honest, see capacity-aware selling. The short version for the CEO seat: if deals are consistently being rescoped in the first two weeks after close, the rescope should have happened before the proposal went out. Capacity pressure is visible weeks or months in advance. Sales just needs to be looking.
Stage two, the close
Close-stage bottlenecks are usually buyer-side, not firm-side. Procurement timelines, legal review, budget cycles. A CEO has limited room to push here, and the usual mistake is to push in the wrong direction by discounting.
Discounting to accelerate close trades future margin for current pipeline movement. Sometimes correct. Often a reflex. The rule of thumb that survives real deals is the trade rule: never discount without a trade, and the trade has to be structural (scope, term, payment, case study rights), not cosmetic. For the mechanics of that rule, see how to discount without losing margin.
The bigger lever at this stage is usually not price. It is the shape of the proposal itself: whether it names the kickoff-readiness criteria in the SOW, whether payment milestones are structured to reduce buyer-side risk, whether the scope is honest enough that the legal review does not discover ambiguity two weeks in. A proposal built to move through procurement cleanly closes faster than a proposal at the same price with messier structure.
Stage three, signed-to-started
This is the stage most CEOs do not measure. Which is unfortunate, because it is often the biggest lever they have.
Signed-to-started is the interval between contract signature and the first day real delivery happens. In a healthy deal it is a week or two. In a lot of firms it is four to eight. What lives in that time is a predictable set of activities: rescoping for reality, staffing confirmation, paperwork, buyer-side readiness, handover archaeology. None of those activities needs to take as long as it does.
Compressing signed-to-started by three weeks on a typical growth-stage firm's deal mix can add a full month of recognised revenue to a quarter without changing bookings, hiring, or utilisation. That is money that was already sold, arriving earlier, at zero additional cost. Most firms leave it on the table because the gap lives between sales and delivery ownership boundaries.
The intervention is measurement first, then compression. Track the interval on every deal. Look at the average and the 90th percentile by practice and deal size. Move rescoping upstream. Name kickoff-readiness criteria in the SOW. Staff deals at 70% likelihood, not at signature. For the full argument, see the signed-to-started gap.
Stage four, delivery without burnout
Delivery-stage velocity is a capacity problem, not a productivity problem. The firms that ship well do not have faster consultants. They have more honest capacity plans and better coordination between practices and sales.
The operating shape that works: a weekly capacity review where delivery leads reconcile committed work, weighted pipeline, and exposed demand at the role level. Hiring decisions and contractor commitments fall out of that review, not out of a Friday panic. The guide on capacity planning for technology solution providers covers the mechanics in depth. The CEO-seat version is simpler: if utilisation is a blended monthly number rather than a role-level weekly number, the firm is reading a metric that lies to it.
The burnout lever sits next to the capacity lever. A delivery team running at 95% role-level utilisation every week with a pipeline that exposes another 40% in the next 12 weeks is already in trouble. The CEO needs to see the exposure number, not just the utilisation number, or the hiring conversation happens three months too late.
Stage five, invoice and recognition
Stage five is often the one finance knows about and the rest of the firm does not. A deal's commercial structure determines how its revenue is recognised, and the default structures in most services proposals are optimised for the buyer, not the firm.
Three moves matter here.
Tie payment milestones to deliverables, not dates. Milestone-based billing can turn a deal with a six-month delivery into one with three meaningful revenue events, instead of a large invoice at the end. It also reduces the firm's exposure if scope changes late.
Structure recurring work as recurring. Managed services, support, licensing, and hosting are not "project leftovers". Model them as recurring revenue with unit-based pricing, separate from the build. For the mechanics, see how to estimate TCO for services.
Keep the proposal, the SOW, and the invoice on the same data model. The reconciliation job between what was sold, what was delivered, and what was invoiced is where finance teams lose days per quarter. If the proposal, the SOW, and the invoice line items trace back to the same estimate, most of that reconciliation disappears.
The CEO dashboard
Five numbers. That is the whole list. Every firm I have seen with a working grip on revenue velocity tracks these or something close to them. Most firms that do not have that grip track only the first two.
Bookings. Deals signed in the period. Table stakes. The headline number that can mislead you about everything else.
Win rate adjusted for deliverability. Not the raw win rate. The win rate on deals that closed and also started within a target signed-to-started interval. A deal signed but not started in 90 days is not the same as a deal signed and started in 14. This is a leading indicator of delivery trouble.
Signed-to-started, average and 90th percentile, by practice. The single most under-measured number in a growing firm. Moves first when the firm is running too hot. Moves again, in the wrong direction, when delivery starts to crack.
Role-level exposed capacity, next 12 weeks. Not blended utilisation. The worst-subscribed role-month in the next quarter, across committed plus weighted pipeline. If this is above 120% anywhere, a decision is due this week.
Delivered gross margin vs sold gross margin. Sold margin is what the proposal said. Delivered margin is what the finished work earned. The gap between them is the price of everything that went wrong between stages one and five. Persistent gaps over two percentage points are a signal, not a noise.
If a CEO has those five numbers on a weekly cadence, the conversation at the executive meeting stops being "how was the quarter" and starts being "which stage is costing us this week". That shift is what revenue velocity is about.
What breaks at 75, 150, 300 people
The cycle breaks in different places at different sizes.
At around 75 people, the breakage is usually at stage one and stage three. Sales is selling shapes the firm cannot consistently deliver, and the gap between sign and start is opening up. The firm is small enough that heroics cover the crack. The CEO can fix it by getting sales and delivery in the same room weekly for 30 minutes. What gets captured in that room is the beginning of a capacity discipline.
At around 150 people, the breakage moves to stage four and the coordination between practices. The Friday panic moves from "do we have someone for this" to "which practice owns this handoff". Multi-practice deals become the norm, the capacity sheets drift between practices, and sold vs delivered margin starts showing a persistent gap. The fix is structural: one commercial model, one capacity view, one handover ritual, enforced firm-wide.
At around 300 people, the breakage is in stage five and the data model. Finance is building shadow trackers. Delivery and sales are using different deal IDs. The proposal, the SOW, and the invoice do not trace back to the same estimate, and the reconciliation job becomes a week of finance time per quarter. The fix is unglamorous: collapse the data model so the deal is one object through all five stages, not five objects with a loose thread between them.
For the capacity-side view of the same scale problem, see capacity planning for technology solution providers. For the margin-side, see stop guessing margin at the point of sale.
One model across the five stages
Estii carries the full cycle on one object. The five stages above are not five tools; they are five views on the same deal. That collapse is what turns revenue velocity from a feeling into a measurable thing.
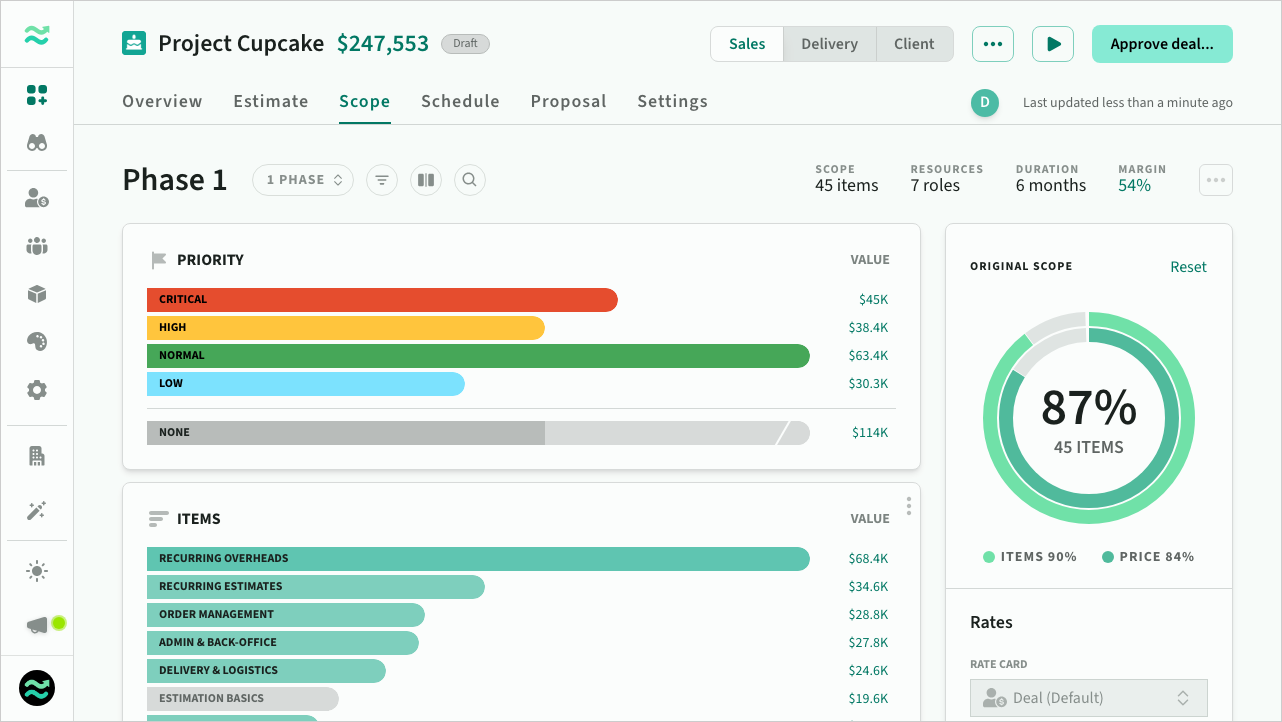
Scope rescope regenerates the proposal
Click any priority, item, or workstream on the scope page to descope or defer it. Price, schedule, milestones, and every breakdown recalculate in one interaction. Regenerate the proposal and the SOW appendix reflects the new scope at the new price on the new schedule. Two clicks to rescope, two clicks to regenerate. The drift between what was quoted and what gets delivered closes at the source, not at the handover.
 Scope rescope recalculates price, schedule, and proposal together
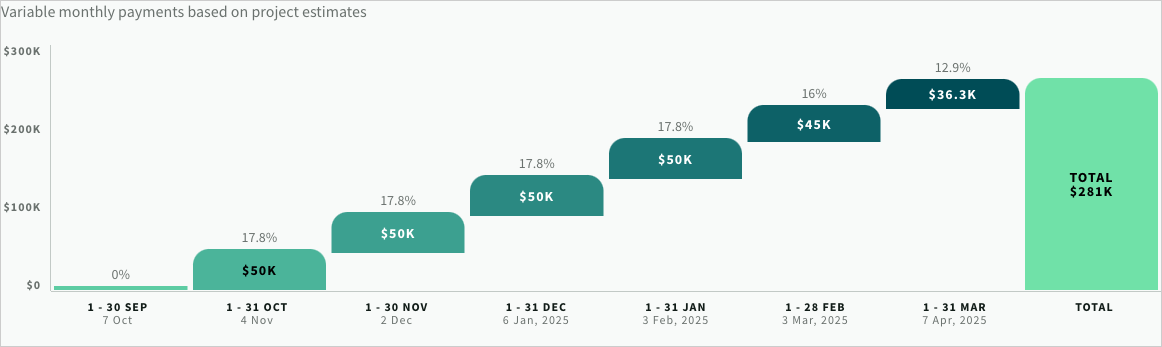
Set up dynamic payment milestones that adapt to scope, schedule, and phasing
Payment milestones live on the deal overview and ship as a waterfall on the proposal and the SOW appendix. Presets cover the common shapes: thirds, halves, monthly, quarterly, phase-status triggers, bespoke dates. Milestones rescale automatically when scope, price, or duration moves, so a rescope late in the cycle does not silently break the payment plan that made the commercials work. The same milestone definitions drive revenue recognition in the forecast views below, which is how a deal-level artefact becomes a finance-level signal without a reconciliation step.
 Payment milestones waterfall chart
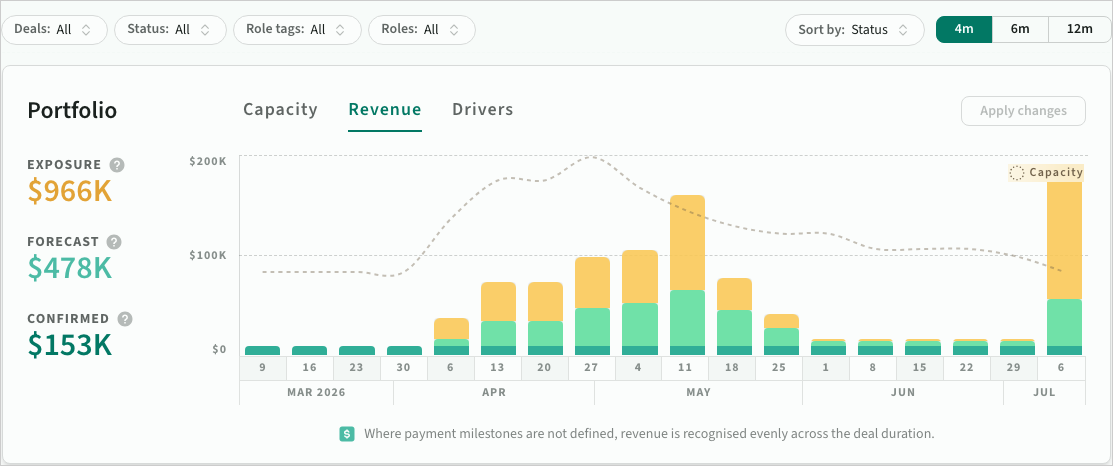
Forecast revenue timing off deal probability and milestones
The Forecasts revenue view recognises revenue off payment milestones where they are defined and falls back to sensible straight-line recognition where they are not. Each open deal contributes at its stage probability, so the curve reflects what is actually likely to land, not just what has signed. Move a deal's start date or adjust a milestone and the curve redraws. Finance reads the recognised-revenue view from the same deal object sales is quoting from, so the shadow-sheet reconciliation that usually kicks in around 300 people never starts.
 Forecasts revenue view driven by payment milestones and deal probability
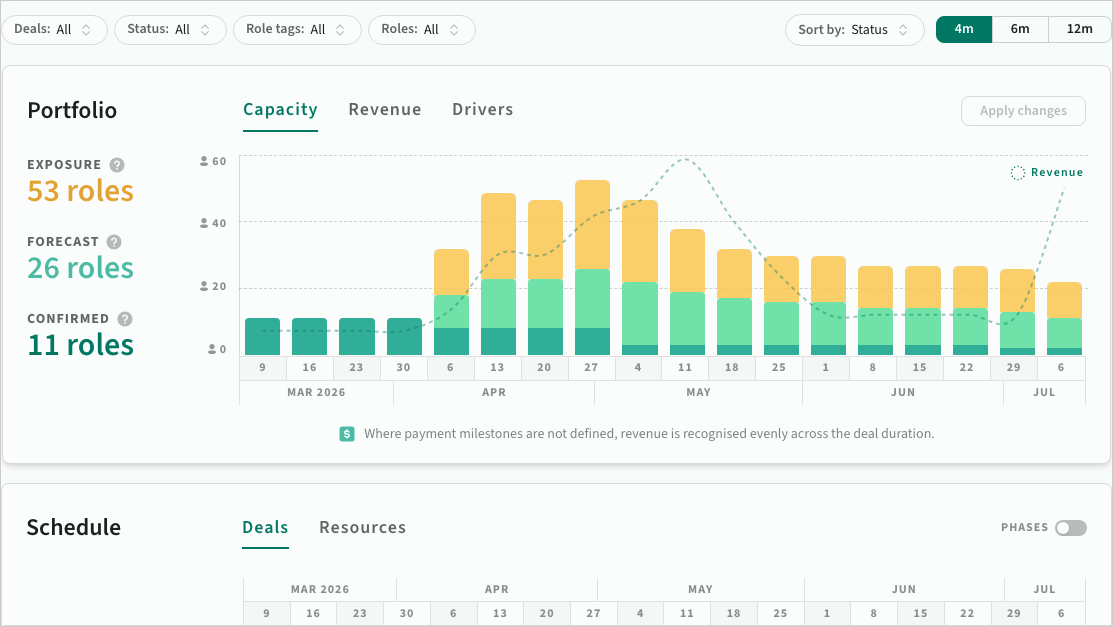
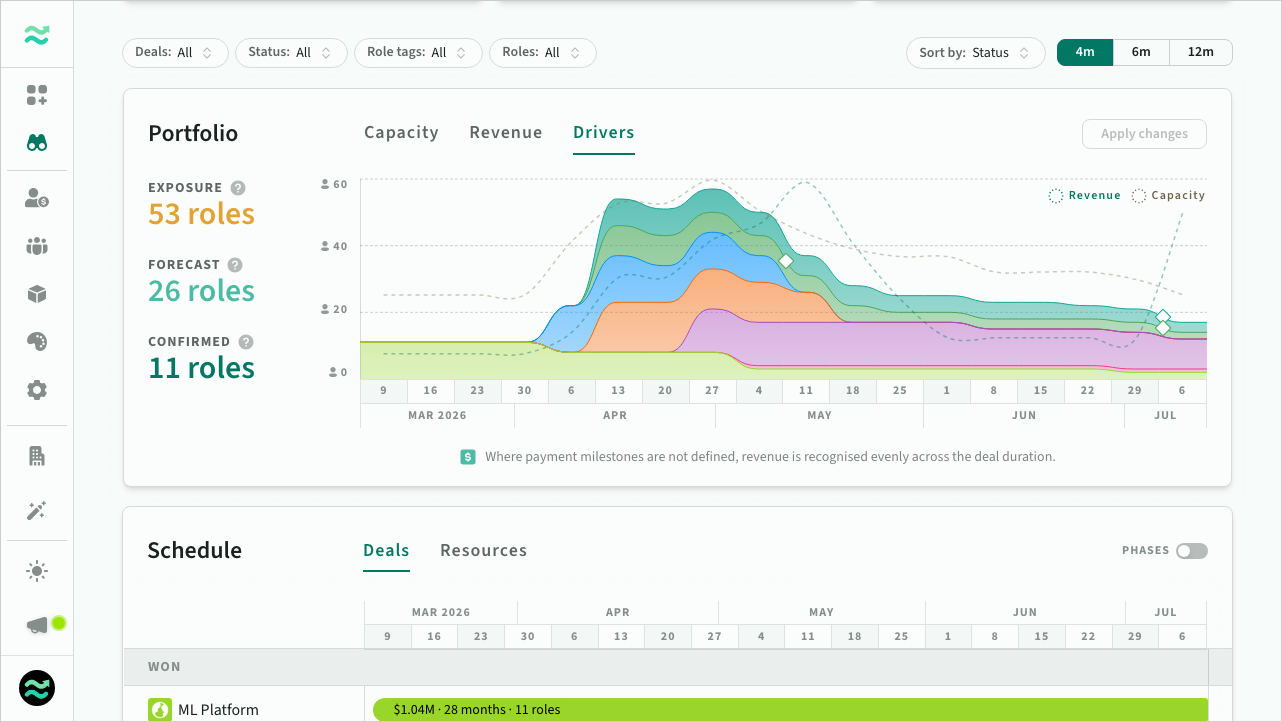
See how forecast capacity demand aligns to revenue timings
The same portfolio carries role-level capacity at three layers: Confirmed (signed work), Forecast (pipeline weighted by probability), and Exposure (if every open deal lands). Capacity and revenue are reading from the same deal schedules and probabilities, so a month with a revenue peak usually has a capacity peak to match and a revenue trough usually hides a capacity trough. Looking at both curves against each other is how CEOs catch the quarter where sales and delivery are about to disagree.
 Three-layer capacity forecast aligned to the revenue timings above
See how deals drive both, drag and drop to reschedule
The Drivers view surfaces which specific deals are creating the peaks and troughs in both views above. Hover a deal to light up its schedule rows and resources across connected views. Drag a deal along the timeline to preview a rescheduled shape and see capacity and revenue move with it, then apply in one step: locked deals snapshot for traceability, draft deals update immediately, stale edits are flagged before they overwrite. The weekly conversation becomes "move these two by a fortnight" rather than "hire three more".
 Drivers view, dragging a deal to reschedule capacity and revenue together
What this looks like in practice
The CEO and head of delivery open Forecasts on a Monday. Capacity shows senior Dynamics at 118% exposure in July; revenue shows a matching July peak and a sharp August trough. Drivers surfaces four deals stacking on that role: two signed, two open. They drag the two open deals into August. Capacity drops to 94%, revenue smooths across the quarter, and the moved deals snapshot as new versions on apply.
One of those deals needs a narrower scope anyway. The presales lead descopes two priorities, the milestone waterfall rescales, and the regenerated proposal ships the new shape at the new price. Under an hour across both deals.
Wrapping up
Revenue velocity is the CEO metric that matters when the firm is growing faster than the parts of it can coordinate. Bookings do not measure it. Delivery does not measure it. Finance measures the output but cannot see the inputs. Holding the whole cycle as one thing, and asking every quarter which stage is costing the firm the most, is the job only the CEO can do.
The firms that do it well do not run faster than their peers. They run more honestly. The delivery team is not being asked to deliver shapes it cannot staff. The sales team is not selling into months it cannot serve. Finance is recognising revenue on a cadence the operations actually support. Growth and margin start to travel together again, which, quietly, is what all of this is for.
If you want to read the cycle from one end at a time, start with capacity-aware selling for the sales side, the signed-to-started gap for the middle, and capacity planning for technology solution providers for the delivery side.

